Statistics in Marketing - Continuous Probability Distributions

In this second article, I will cover some examples of continuous probability distributions. This will be part of a series where I explore how knowing statistics can be helpful to a digital marketer in a simplified view.
You can refer to my earlier article on discrete probability distributions.
Recap
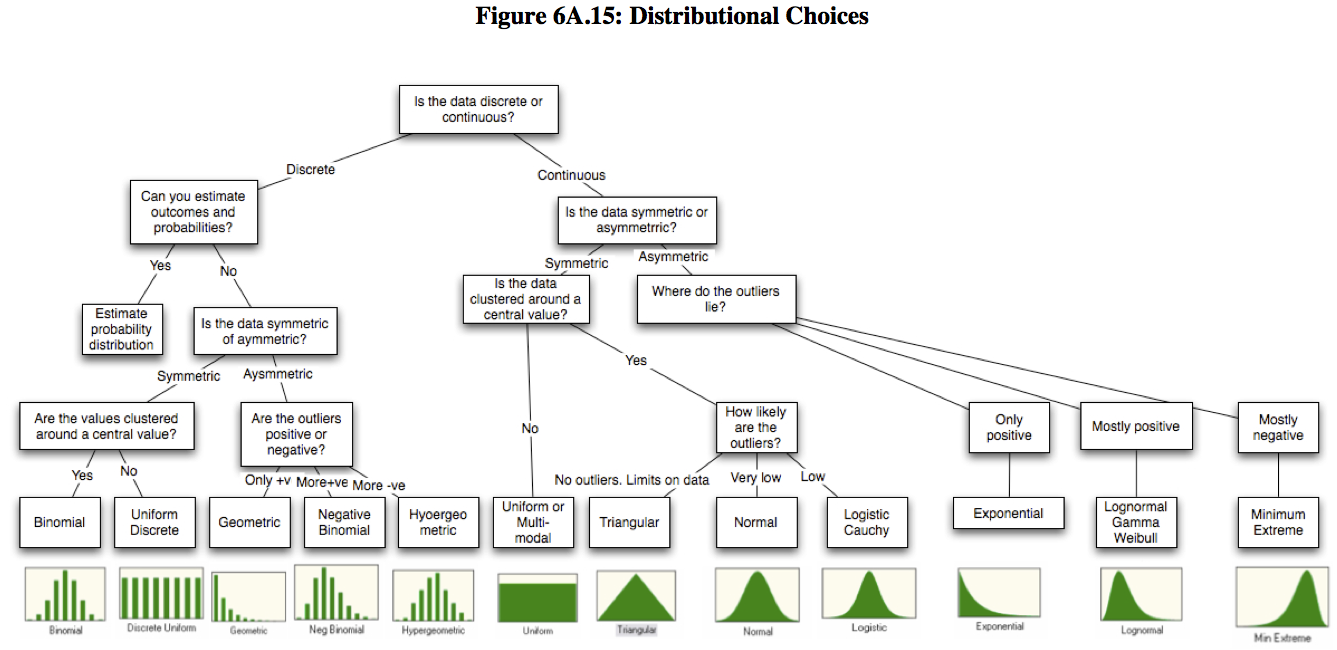
In the last article, we covered some discrete probability distributions which you may come across when looking at the data which your marketing campaign generates. We also touched on a simple way to understand if your data is discrete or continuous, and that is to answer the question: “Are the number of your outcomes finite?"
A “No” to the above would mean that the dataset is likely to continuous.
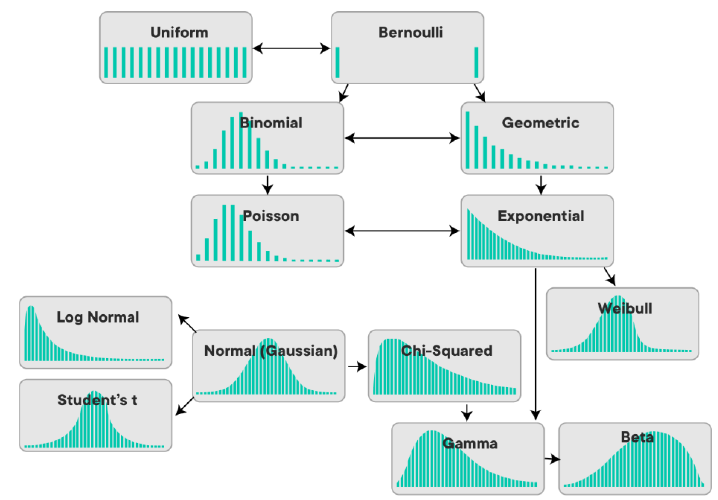
Examples of Continuous Probability Distributions
Continuous Uniform Distribution
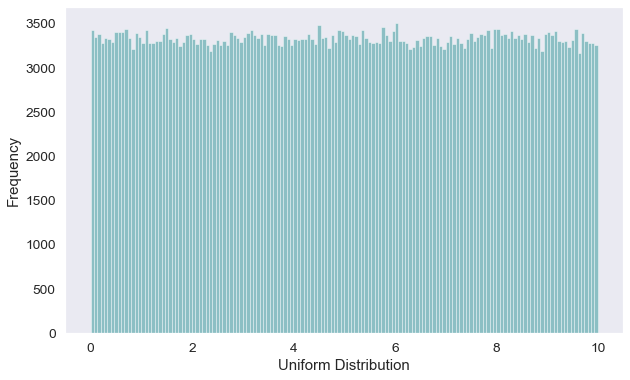
Similarly to the Discrete Uniform distribution, the Continuous Uniform distribution represents variables that are evenly distributed over a given interval. Unlike the Discrete Uniform distribution, where values are countable (finite), the variables in the Continuous Uniform distribution are infinite (uncountable), such as, timings / revenue over ads spends / profit margin.
Supposedly you are running a region wide baby contest, where you record the smiling time of the baby contestants, in seconds. You may get a Continuous Uniform distribution where the babies having a smiling time from 0 to 10 seconds to be equally likely.
Normal (Gaussian) Distribution
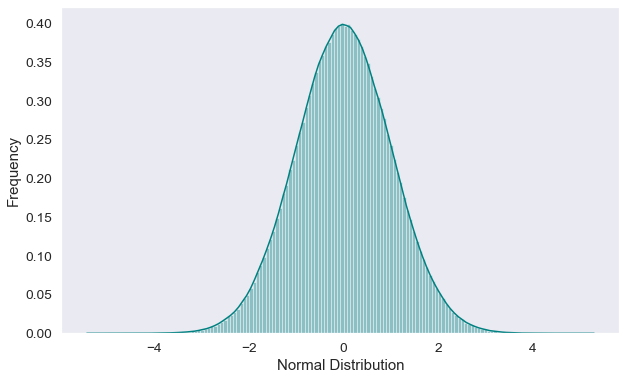
Also commonly known as Gaussian distribution or bell curve, the main difference between Normal distribution and Binomial distribution is that Normal distribution is continuous. This means that while there are finite amount of events (no values between one FB like & two FB likes) in a Binomial distribution, in the Normal distribution, the number is infinite within a range (multiple values exists between $1 & $2 ).
Exponential Distribution
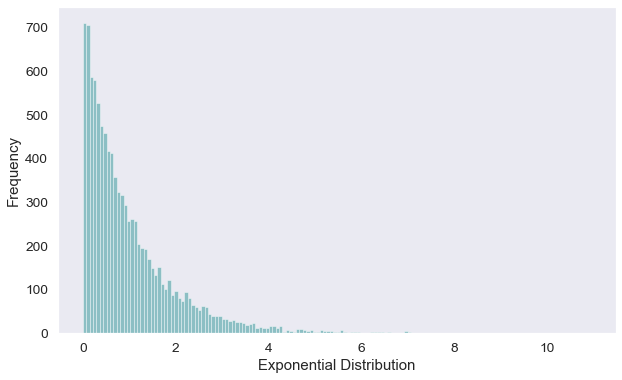
Lastly, the Exponential distribution can be use to show the time taken until the occurrence of some specific events. In an Exponential distribution, there are few large values, and more smaller values.
Some situations where Exponential distribution may be modelled, “number of days ahead traveler purchase airline tickets” / “the amount spent by customers when they shop at your e-commerce site”. In these scenarios, you may observe that there are more people booking airline tickets nearing the flight date and fewer people who made reservations well in advance / more people spending smaller amount of money per visit and few who will make bigger purchases.
End Notes
There are many different types of distributions and each one describes a different situation. Not undermining the rigor that goes behind statistical studies, I hope is that this articles would provide non statistical audience with some sort of idea when looking at the data presented and engage in meaning discussion with your analytics team to further understand the situation where these distributions exists.
